There are numerous tools out there in the market and picking the right tool to help you troubleshoot an issue or understand the underlying workings is very important. We would like to share a few tools which benefited us while we were troubleshooting issues related to front-end browser debugging.
Firefox Developer Tools helps with debugging, editing, monitoring CSS, HTML, DOM, and JavaScript. The core tools of Firefox Developer Tools are Javascript debugger, page inspector, web console.
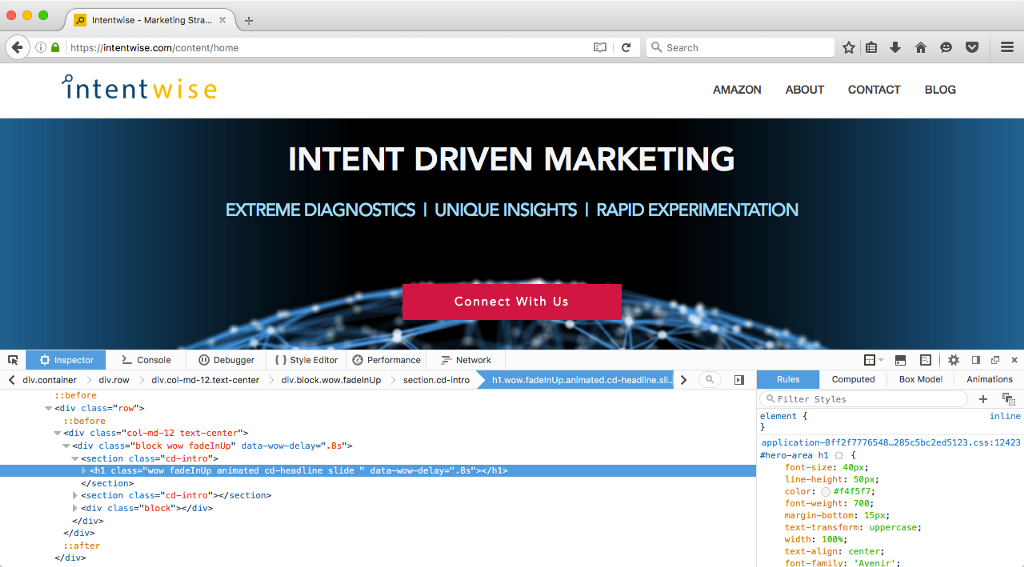
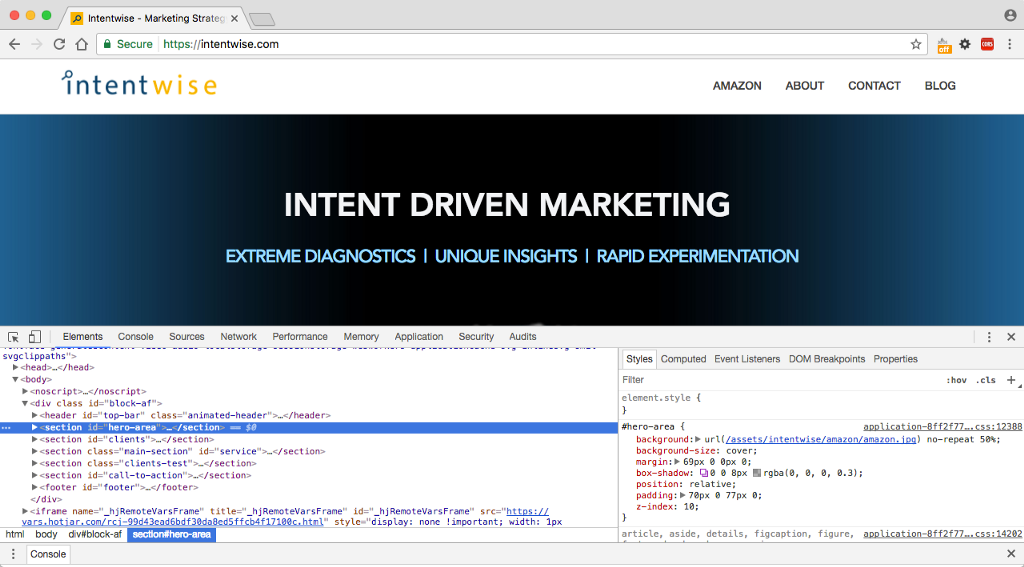
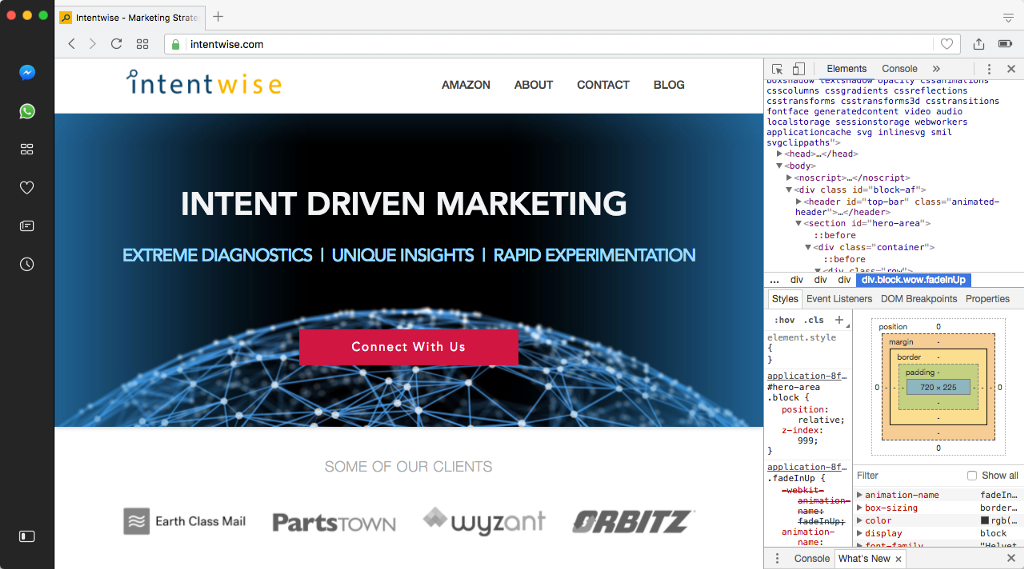
Inspect an element is a tool embedded in your browser to check the underlying code of a particular web page, you just have to right-click on the browser and you can find “inspect” you click on that you’ll be able to find the HTML, CSS, and styles. you can edit the elements in the Document Object Model (DOM) and change the CSS styles etc.
There are different tools for debugging for different browsers.
Firefox: Firefox Developer Tool
Chrome: Chrome Developer Tool
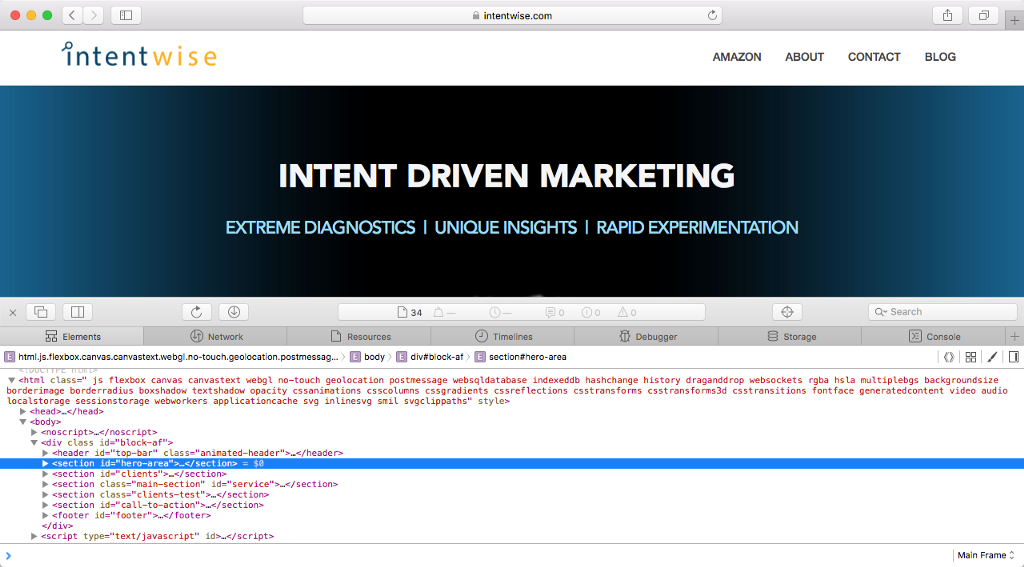
Safari: Safari Web Inspector
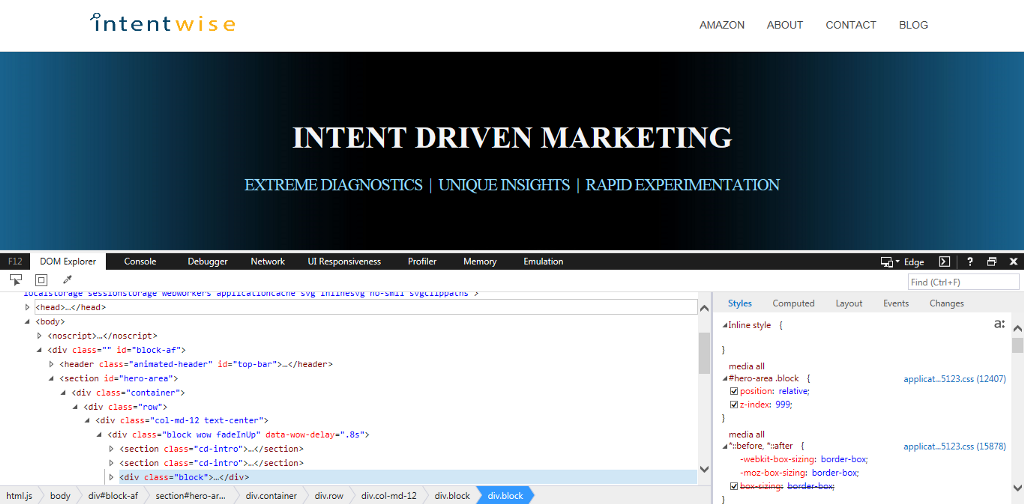
Internet Explorer: Microsoft Edge F12 Dev Tools
Opera: Opera Developer Tools
Javascript Debugger: All the modern web browsers have built-in javascript debuggers. If your browser supports debugging, you can use console.log() to display JavaScript values in the debugger window, The debugger keyword stops the execution of JavaScript, and calls (if available) the debugging function.
You can check your JavaScript code for bugs by running it through a program that checks it to make sure it is valid and that it follows the official syntax rules of the language. These programs are called validating parsers or just validators and often come with commercial HTML and JavaScript editors.
One such validator for JavaScript is JavaScript Lint .
Simple ways to debug javascript is to use alert() and document.write() methods in your code.
CSS debugger: Pesticide is a simple stylesheet to debug your CSS layouts. It is also available as a Chrome extension. It places an outline on every element that can help you figure out what’s wrong with your layout. You can use it by inserting this “<link rel=” stylesheet” href=”css/pesticide.css”>” inside your header tag.
You can use CSS lint just like javascript lint and other CSS validator services.
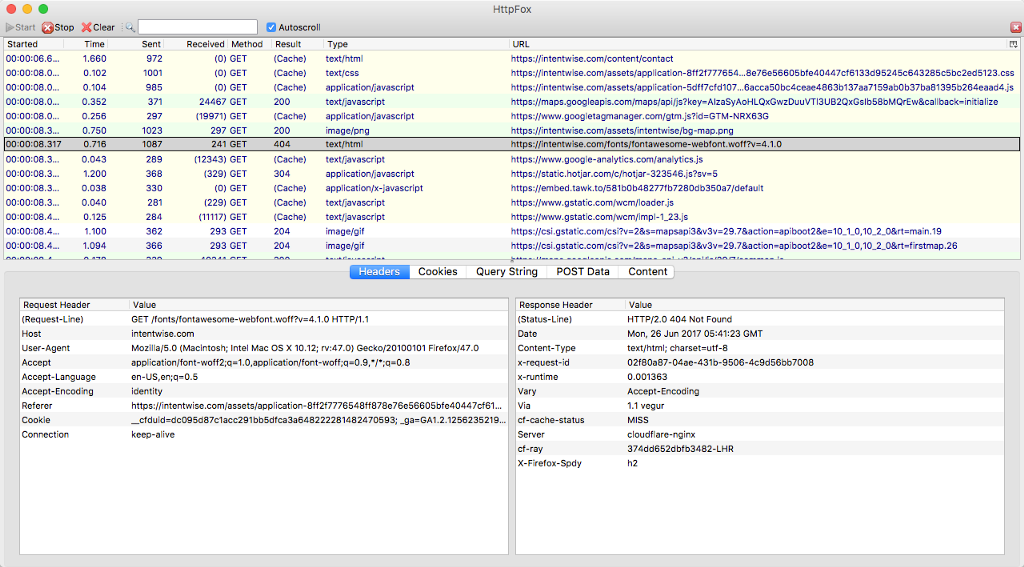
HttpFox: HTTPFox is a packet sniffer add-on for Firefox or Edge browsers. The HttpFox is used to analyze the HTTP traffic between the browser and web server.
We will be able to monitor:
- Request and Response header.
- Cookies.
- Query String.
- Post Data.
- Content
Open any page in the Firefox browser. Start the HttpFox (In Mac OS open the view tab on the top and click on the HttpFox) Press start and the data starts showing up as soon as you visit a web URL. Various tabs can be seen such as headers, cookies, query-string, post data, content. These are basically related to the web page you are browsing. It is very useful to understand the network hops, query parameters that get passed around and also to review the redirects with each request.
Header: These allow the client and server to pass additional information back and forth within a request and response. The request header tab shows the information about the resources that are fetched from the server and the Response header shows additional information about responses like location and responses that need to be sent to the client.
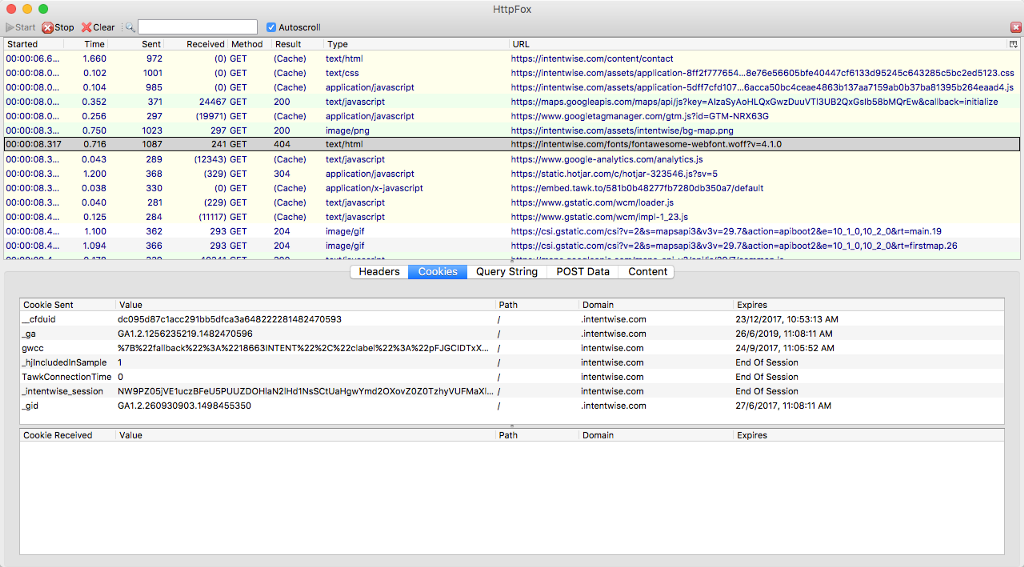
Cookies: A cookie is basically a text file stored by the webserver on the users’ machine. The cookies are accessible only to the server which creates it. The cookie tab contains received cookies that are sent by the server to the browser.
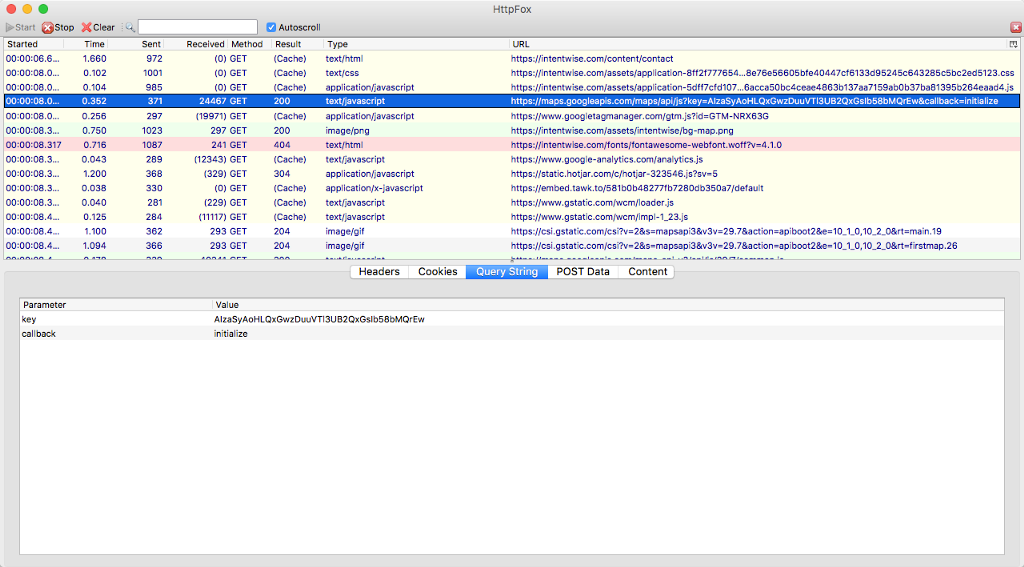
Query String: Query string is the parameters(key/value pairs) that can be reviewed within the query string window. These key-value pairs are often passed by the webpage to external servers.
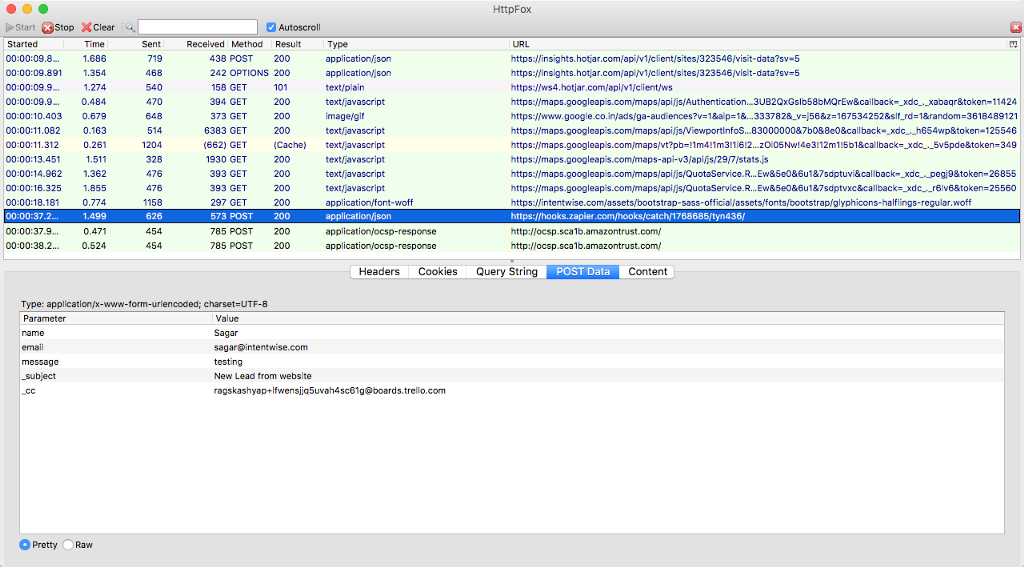
Post Data: In the post data tab we can see the data being posted for eg: the data posted from the contact form we can check whether all the data are being posted or not.
Content: The content tab in the HttpFox contains the HTML contents of the web page you are monitoring. This can be further analyzed by using the Inspect element which is much better suited to analyze the layout and content within a web page.
Read our post “Ensure Data Consistency Between Databases with dblink” to understand how we at Intentwise deal with the challenge of replicating across data sources.