We’re expanding upon the data strategy techniques outlined in our white paper, “Developing a 2022 Amazon Data Strategy.” Check out our first post on the importance of collecting and owning data.
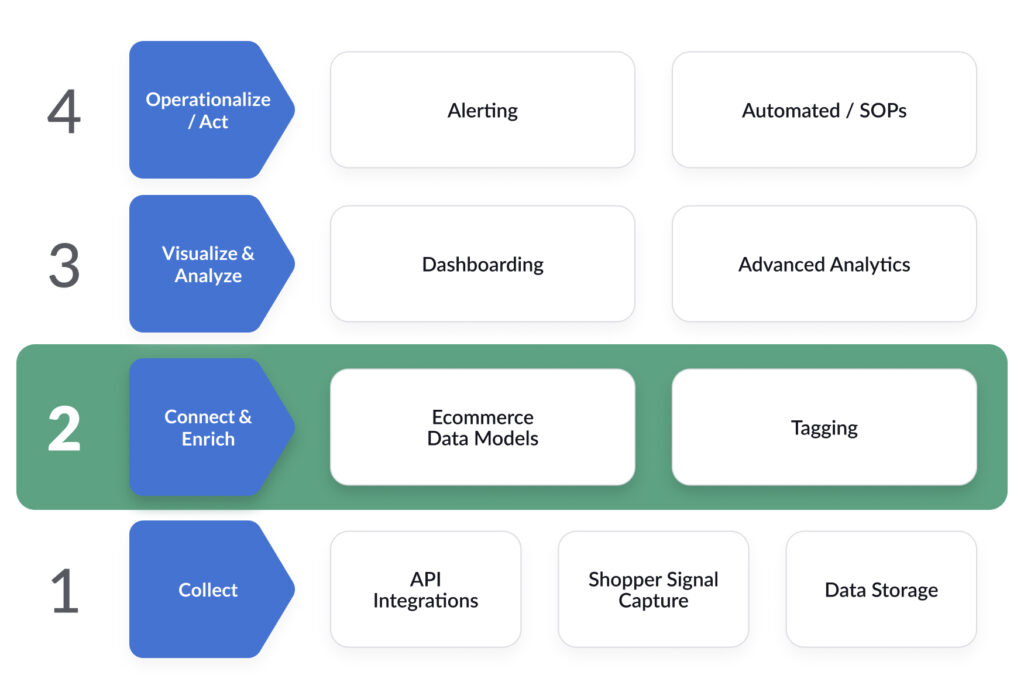
Once a company collects its Amazon data, it can move into the next phase of building a data strategy: connecting and enriching the data. Individual data sets (information on advertising, sales, inventory, and more) only tell parts of the whole story of a business, which is why it’s crucial to connect siloed pieces of information together.

When an ecommerce company connects these data sets together, the business can start to observe scenarios—and, more importantly, act upon those observations—in ways it could not before. In a very basic example, if a brand connects advertising and overall sales data together, it can then track not just advertising cost of sales (ACOS), but also total advertising cost of sales (TACOS). More complex levels of analysis could include: tracking inventory levels and making decisions on ad spend at the product level; tracking ad performance and organic ranking at a keyword level; and connecting sponsored ads, Amazon DSP, and organic sales to understand the correlation between overall ad spend and top-line revenue.
Enriching data with additional attributes can help further segment data and extract new insights. For example, advertisers can assign brand versus non-brand attributes to search terms, keywords, and product targets to determine the best way to spend their ad dollars. Additionally, companies can assign categories specific to their business to their products for deeper, custom analysis.
Next up: the importance of visualizing and analyzing Amazon data.
This post has been updated.


