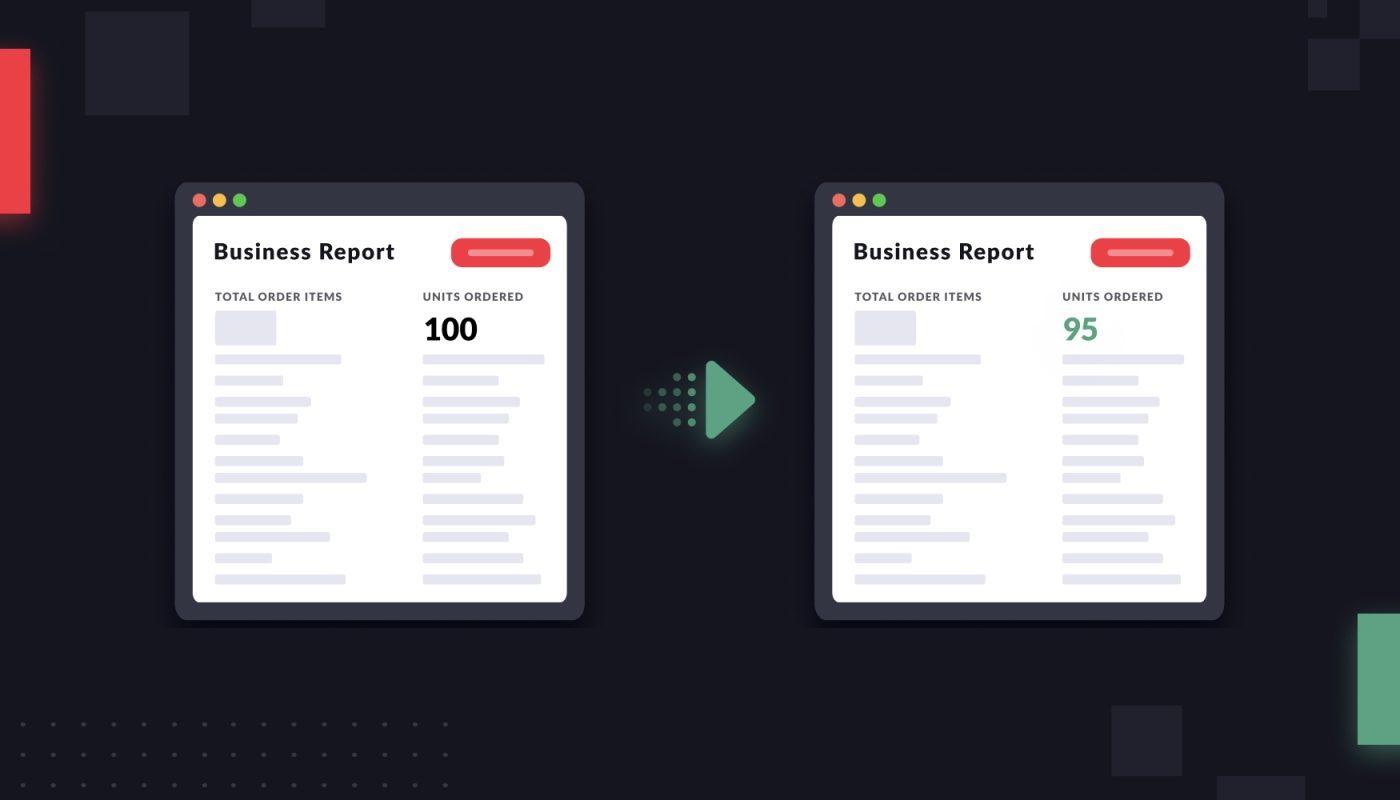
You have probably had the experience: You look back at an ads report or a sales report in Seller Central, and you realize the historical data has changed. Even when the time range you select is the same—say, April 1 to April 30—the numbers might vary week to week.
Historical data changes are a regular part of the Amazon ecosystem. Remember, your Amazon reports are merely a snapshot in time.
As new information comes to light—about traffic, returns, or sales conversions—your reports are going to change, too.
Changing historical data is not a cause for concern. Amazon is always tweaking old data to account for new events and fix mistakes. But you need to keep in mind that these data points are not final when you look at them.
Below, we’ll walk through what you need to know about historical data changes—and why, if you’re not careful, they can impact your bottom line.
Do historical data changes impact sellers and vendors?
It’s important to note that historical data changes happen to third-party sellers and first-party vendors alike. While the focus of this article will be on Seller Central, in many ways the historical changes in Vendor Central are more extreme.
As an example, in Vendor Central, when a customer returns a product, Amazon actually removes the sale from your Orders report. So you suddenly display fewer sales than before. This can mess up your accounting if you’re not careful.
For more on Vendor Central data changes specifically, tune into our webinar on mapping VC data.
Why does Amazon change historical data?
Historical data changes fall into a few big categories:
Returns data: This is probably the most self-explanatory example of historical data changes. Amazon allows customers to return a product within 30 days of delivery. It can take as much as another 30 days for Amazon to process that order and update it on your seller account. Amazon then updates your sales numbers and your returns count accordingly.
This is all to say that there can be something like a 60-day window after an order delivery for a return to be counted. Your historical data will continue to update as those new returns come in.
Bot traffic: Amazon gets a lot of bot traffic to its product pages. This leads to the overcounting of page views (or glance views if you’re a vendor) on your listing page. It happens often, but the impact is negligible in many cases.
The company is always trying to identify these bots and remove them from your reports retroactively.
Click fraud: Sometimes, clicks are more targeted. If a click farm starts going through your ads, Amazon detects this and ensures you don’t pay for clicks that were not from a genuine Amazon shopper.
In this case, it could make a big difference in your bottom line because you’re spending money that you otherwise wouldn’t.
A 5% click through rate for the month of April might drop down to a 4.7% click through rate, depending on the number of bots that Amazon finds.
How do you know how many bot clicks you’re getting? Luckily, it’s easy to troubleshoot historical changes in traffic data. Amazon keeps track of the bot traffic and other fraudulent traffic in its Gross and Invalid Traffic Report.
If you want to quickly understand why your traffic numbers or clickthrough rate changed, this report can help.
Ads reports: Your ad-attributed sales numbers often increase retroactively.
To understand why, think about attribution windows. Sponsored Brands ads, for instance, have a 14-day attribution window. That means SB ads can get credit for any sale that happens within 14 days of a shopper interacting with it.
When you download a report that includes yesterday’s data, for example, its attribution window is still probably active.
To make this concrete: Let’s say you download a Sponsored Brands ad report from April 1-30. The shoppers that engaged with your Sponsored Brand ad on April 1 will have complete data, while those same shoppers/clicks who engaged on April 29th don’t.
As more people who saw that ad buy from you in the coming days, the data in your April report will change retroactively. This impact is most significant in the first 5-7 days after an ad runs.
Sales reports: When a customer returns your product, Amazon actually removes sales from certain reports. Let’s say you make 100 sales on April 1, but 3 of those products are returned later.
Your sales numbers listed for April 1 will drop from the initial 100 down to 97 later. Yet Amazon doesn’t do this for every report: it’ll remove sales based on returns from your business reports, for instance, but not from your Orders report.
You need to keep track of which reports are returns-adjusted and which are not, or else you might mess up your accounting.
How long should you wait until you know your data is final?
Amazon can tweak your historical data potentially at any time, as new events occur. But generally, after 3 months pass, your data is as close to set in stone as it will get.
The shifts you see in your historical data might not be enough to completely reframe the success of an ad campaign. Amazon playing around with specific traffic numbers is not going to turn an abject failure into a big success.
But these historical data changes can change how you evaluate your performance at the margins.
It wouldn’t be unreasonable for historical changes to improve your ACOS by a couple of percentage points, for instance. So a mediocre-looking campaign might come out looking pretty good.
Here are three possible scenarios where historical data changes might influence your overall strategy:
Inflated cost of advertising. Let’s say one of your campaigns gets a particularly high number of fraudulent clicks. Because Amazon sponsored ads use a cost-per-click system, you’re paying for all of those clicks.
But if the clicks come from bots, then you almost certainly won’t get sales out of them.
In this case, an otherwise successful campaign might look extremely unprofitable and not worth it. That is, until Amazon adjusts the historical data and excludes the bot clicks. With the bots filtered out, your conversion rate will go up, and your ACOS will go down.
High return rate. An ad campaign might look very successful when you analyze it after, say, 3 weeks. Let’s say you encountered a much higher-than-usual conversion rate, and your ACOS was way down.
But what if that campaign ends up seeing a correspondingly high return rate? Maybe your campaign messaging was accidentally misleading, and shoppers were disappointed by what they got. You won’t be able to see until you wait to see your full returns data.
Lengthy time to conversion. A slightly less obvious way that historical data changes can lead you to re-evaluate your campaigns is about attribution windows. Remember, your Sponsored Brands and Sponsored Display ads can get credit for a sale up to 14 days after an ad click.
So as the attribution window runs out, Amazon will credit late-breaking sales back to that particular campaign.
Paying attention to attribution windows is especially important if you sell a product like high-cost jewelry, which has a long Time to Conversion. Your customers might take a week or two to buy from you after seeing your ad.
Let’s say 10% of your ad-attributed sales happen 7+ days after the ad click. If you evaluate your ads too soon, you might overlook the success of a campaign that had a slightly long Time to Conversion.
So how do you get around historical changes?
If there’s one big lesson from understanding historical data changes on Amazon, it’s to be a little patient.
You can make a preliminary evaluation of your ad campaigns a week after it happens, but you should be open minded about the fact that historical data changes might slightly alter your perception.
Ultimately: Be sure you are regularly checking your historical data to see if any data points have shifted enough to influence your strategy or your metrics of success.
When you look at your data, keep these different time horizons in mind. It’s okay to look at yesterday’s data, but be sure you’re also looking at the last 2 weeks or last month for a reference point.
The other big lesson is to download, download, download.
Only if you download all of your Amazon reports at a regular rate can you identify when your data changes. You want to have a record of what changed—and by how much—so you can update your analysis accordingly.
All of that downloading is a pain to do by hand, but when you work with a software partner like Intentwise, we can do this for you. We are constantly updating data from Amazon via API.
We’re not only able to track what changed, but we also ensure your data is as up-to-date and accurate as possible.


